VTAnDeM: A Python Toolkit for Simultaneously Visualizing Phase Stability, Defect Energetics, and Carrier Concentration
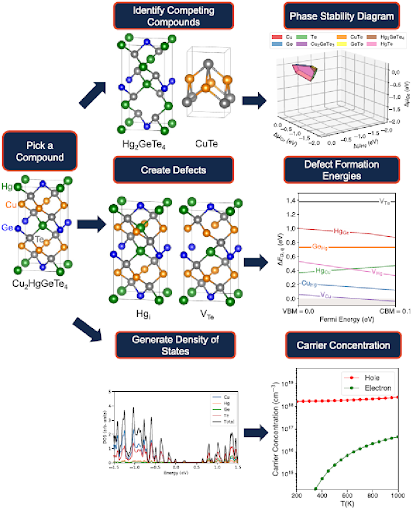
VTAnDeM offers a graphical interface that allows the user to interact directly with the chemical phase space of a given material and to visualize the defect formation energetics and ensuing carrier concentrations.
M. Y. Toriyama, J. X. Qu, L. C. Gomes, and E. Ertekin

Defect thermodynamics are often studied from the perspective of phase stability and defect formation energetics using first-principles calculations. The results are comparable to experimentally-measurable carrier concentrations. However, visualizing all properties simultaneously by exploring the multidimensional chemical phase space is not trivial.
VTAnDeM offers a graphical interface that allows the user to interact directly with the chemical phase space of a given material and to visualize the defect formation energetics and ensuing carrier concentrations. The computational methods derive from standard defect theory within the supercell approach. The synchronous visualization scheme provides a streamlined approach to analyzing defect-related properties in semiconductors and insulators, all in real time.
The inputs provided by the user are (i) the total energies of the main material and competing phases, (ii) the energies of native defects and dopants, and (iii) the density of states of the main material. VTAnDeM uses these inputs to generate (i) phase stability diagrams in both chemical potential and composition space, (ii) the defect formation energy diagram, and (iii) a carrier concentration plot. The defect formation energies and carrier concentrations are generated on–the–fly for specified points in chemical potential space and composition space.